Does
Active Use of Technology Market Spur R&D?:
Empirical
Analysis of IP Strategy of Japanese Firms
Kazuyuki Motohashi[1]
Abstract:
A firm level dataset from JPO, from the Survey of Intellectual Property Related Activities, provides detail information on the use of in-house developed IPs and licensing activities for innovation in about 5,000 Japanese firms. By using this dataset in 2002 and 2003, I have investigated the role of patent system in innovation at firm level. It is found that significant firm level variance of IP strategy is left after controlling for technology field, and open strategy firm with active licensing spends more R&D, as compare to the others.
1. Introduction
In an era of global competition and rapid technological progress, Japanese firms have started to seek for external technology sources for their innovation process. According to the Survey on R&D Collaboration by RIETI (Research Institute of Economy, Trade and Industry), the share of firms with R&D collaboration with other firms, universities or public research institutions have increased in these five years, and is expected to increase in future as well. (RIETI, 2004) This trend can be explained by firms�f reaction to changes in R&D environment, such as �efierce competition for innovation speed�f, �ehigher cost of R&D�f and �ecomplexity of technology�f. A departure from in-house development model by Japanese firm pushes up an importance of its IP strategy.
In this paper, IP strategy of Japanese firms is analyzed by using firm level data from JPO�fs Survey on Intellectual Property Related Activities. A focus is put on firm�fs strategy on development of its technology pool (in-house development or external sourcing) and its use (internal use or licensing out of technology) for innovation outputs. Licensing of IPs is an integral part of firm�fs IP strategy, which is determined by various factors. It depends on technology market conditions as well as product market conditions. For example, patent can be used more as a means of appropriating rents from technological innovation in pharmaceutical industry, as compared to in other industries (NISTEP, 1997; Cohen et al., 2002). In addition, competition in market for technology induces licensing activities (Arora and Fosfuri, 2003).
There are also some micro factors at firm level, even after controlling for its industry and technology field. In order to build up technological capability, some firms may put more efforts on technology licensing with firms, universities and research organizations, while the others may focus more on in-house development. Moreover, licensing outcomes are determined by relative position of bargaining power to counterparts, and there may be a firm which is relatively strong at such negotiation. These points are related to �eresource based view�f of firm, implying that firm level heterogeneity of IP strategy depends on sticky and non transferable firm specific assets�B
Analyzing determinants of firm�fs IP strategy and its relationship with firm�fs innovation activities is important for various reasons. First, a departure from in-house development model becomes imperative for Japanese firms, and external sourcing of technology becomes an important business strategy for them to survive in an era of global competition and rapid technological progress. Analysis of IP strategy within a framework of whole innovation process at firm provides useful managerial implications.
Second, recent IPR policy reforms toward pro-patent system by the Japanese Government are based on the assumption that stronger patent facilitates innovation incentives and spillover, and ultimately, accelerates innovation and economic performance. However, only weak evidences of the impact on innovation activities can be found (Motohashi, 2004). Understanding technology market is critical to clarifying the relationship between IPR policy and firm�fs innovation performance, which is needed for appropriate IPR policy formulation.
The structure of this paper is as follows. The next section is devoted for setting analytical framework of firm level IP strategy. In order to grasp IP strategy in a global context of whole innovation process, a framework to understand the structure of firm�fs innovation activities is needed. This section is followed by data description and summary statistics of IP strategy indicators. Then, quantitative analysis section follows. The determinants of firm�fs IP strategy are analyzed with econometrics models, and its relationship with firm�fs R&D strategy is investigated. Finally, a section for conclusion with managerial and policy implications are provided.
2. Analytical Framework of Firm�fs IP Strategy
In this paper, firm�fs IP strategy is defined as a management of its technology pool, which is a firm�fs capacity, based on in-house R&D or acquired technology from external source, used for innovation outputs such as new products and processes. A technology pool is a bundle of IPs as well as know-hows and other intangible assets, but it is narrowly defined as a pool of patents in this paper. Strategic options include in-house development or external sourcing of technology, and in-house use or licensing out of IPs. A technology pool and R&D are closely related each other, and an innovation output comes out from their interactions. Figure 1 illustrates the role of technology pool in this whole process of innovation.
(Figure 1)
One of determinants of IP strategy is characteristics of product and technology market, in which a firm is operating. The strength of patent as a means of appropriating rents from innovation outputs varies by industry, and it is relatively strong in pharmaceutical industry (Cohen et. al. 2002). In this industry, licensing contract can be enforced effectively, so that a firm uses more actively external technology market, in building up its technology pool, as well as licensing out of its technology (Anand and Khanna, 2002).
Licensing decision depends also on the degree of product market competition. Patent right ensures temporary monopoly rents associated with new technology, but licensing out of such technology to potential competitors will lead to increasing competition in product market. In this sense, licensing out has this �erent dissipation effect�f as well as �erevenue effect�f based on licensing incomes (Arora and Fosfuri, 2003). In a market severe competition taking place, it is presumed that rent dissipation effect is smaller. In addition, rent dissipation effect depends also on the market share of each firm. Arora and Fosfuri (2000) show a nice example to support this hypothesis, that is, BP licenses aggressively in polyethylene, where severe competitive takes place and BP�fs market is small, while selectively in acetic acid, where BP dominates it with strong propriety technology.
Another important
factor behind IP strategy is the role of high-tech startups focusing on
technology licensing without production facilities. Without any rent dissipation
effect, they try to license out their technologies as much as possible. Hence,
an emergence of technology specialized firms induces product market
competition, which leads to active licensing activities of firms with
production facilities as well. In chemical industry, entries of SEF (Specialized
Engineering Firms) after World War II, changed licensing behavior of existing chemical
companies toward more licensing one (Arora, 1995). In addition, stronger IPR
system facilitates activities of technology specialized firms, due to
increasing efficiency of licensing market. Hall and Ziednis (2001) argue that
Market imperfection associated with technology market is also an important factor, in analysis of firm�fs IP strategy. There exists substantial transaction cost due to information asymmetry. In addition, patent examination in Patent Office is not always perfect, and possibility of patent litigation cannot be avoided. The degree of market efficiency and enforceability of patent rights affects firm�fs IP strategy. For cumulative systems technology such as electronics and semiconductor, potential litigation costs are higher (Merges and Nelson, 1990). Cross licensing is one of working solutions to reduce the risk associated with patent litigation, and it is a common practice in electronics and semiconductor industry. (Grindley and Teece, 1997)
Decentralized and unevenly distributed information among firms implies that each firm has its own anticipation of patent protection, which leads to firm level heterogeneity of IP strategy. For example, Lanjouw and Schankerman�i2003�jshow that a patent with small firms is more likely to be involved in patent litigations than that in large firms, since large firms have a broader patent pool which can be used for cross licensing, as well as repeated interactions with licensing partners. For fear of patent litigation, it is found that smaller firms avoid patenting in a congested technology area by existing area, for fear of patent litigation (Lerner, 1995).
This argument is related to resource based view of firm, in a sense
that experience of licensing contract and its bargaining power in technology
market constitutes no transferable firm�fs intangible resources. It is important
to identify such firm specific resources, in order to track down firm level heterogeneity
of IP strategy.
3. Data and IP strategy indicator
The dataset used in this paper is based on the Survey on Intellectual Property Related Activities (SIPA), conducted by JPO. JPO started this survey in 2002 for collecting data on various IP related activities including application, licensing and litigation of patent, utility, design and trademark. The survey is conducted for all applicants with over a certain threshold number applications in the previous year[2] and randomly sampled ones for the rest of group. The sample size of 2002 survey is about 16,000 applicants, including firms, individual inventors and research organizations, and JPO collected about 6,600 responses (response rate: 41.1%).
In this paper, a firm level data from 2002 survey (for 2001 activities) and 2003 survey (for 2002 activities) is used. After throwing out individual investors and public research organizations, I got 5,456 samples for 2002 survey and 6,072 samples for 2003 survey with 4,515 overlapping samples in two periods.
SIPA covers a broad range of survey items. The survey consists of four parts, (1) applications of IPR, (2) usage of IPR, (3) information on IPR section at firm and (4) IP related infringements. In this paper, I mainly use the data from section 2, delineating detail information on technology (patent) pool. This section covers data on the number of IPR by various type of status in terms of its usage, such as using by owner, licensed out and in by type of licensing contract.
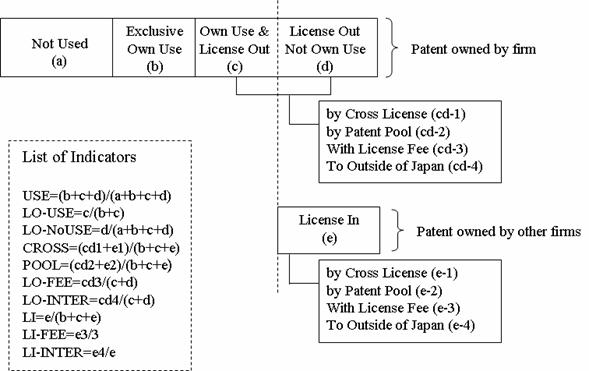
In order to capture firm�fs IP strategy, i.e., the following indicators are constructed by using datasets from SIPA.
�@ USE: The share of patents used either by own or by licensed out to total number of patents owned.
�A LO-USE: The share of patents used by own as well as licensed out to total number of patents licensed out.
�B LO-no USE: The share of patents licensed out but not used by own to total number of patents owned.
�C CROSS: The share of patents licensed out and in by cross licensing to total number of patents used including patents licensed in.
�D POOL: The share of patents licensed out and in by patent pool to total number of patents used including patents licensed in.
�E LO-FEE: The share of patents licensed out with positive royalty fees to total number of patents licensed out.
�F LO-INTER: The share of patents licensed out internationally to total number of patens licensed out.
�G LI: The share of patents licensed in to total number of patents used including patents licensed in.
�H LI-FEE: The share of patents licensed in with royalty fees to total number of patents licensed in.
�I LI-INEER: The share of patents licensed in internationally to total number of patents licensed in.
Figure 2 illustrates concept of these indicators. Firm�fs IP strategy can be cross classified by �ein-house�f or �elicensing�f and by �ebuild up of technology pool�f or �eits use for innovation�f. Strategy of building up patent pool by �ein-house�f or �elicensing�f can be captured by LI. In addition, LO-USE and LO-non USE capture firm�fs strategy whether �ein-house�f or �eopen to external bodies�f in terms of use of patent pool. Other indicators show more detail characteristics of licensing contract, such as cross licensing, patent pool, license with fees and international licensing. Since cross licensing and patent pool entail reciprocal transactions, CROSS and POOL put both ways of licensing patents together. Finally, it is a little bit difficult to interpret USE. This will show the degree to which a firm exploits its patent pool for business. Or, the share of unused patents (1-USE) may reflect the relative size of �edefensive patents�f to ensure its technology options in future.
(Figure 2)
Table 1 shows summary statistics of these indicators. In this table, assuming IP strategy at firm is stable over two period of survey timing, I pooled 2002 and 2003 data together with taking average of values for overlapping samples. In addition, figures in Table 1 are calculated for the sample with any positive number of patents owned in this pooled dataset.[3]
(Table 1)
In terms of size and age distribution of IP strategy indicators, the smaller and the younger the firms, the more actively they use licensing transactions. This pattern is particularly found in the age distribution of LO-USE, LO-non USE and LI, implying that young firms tend to use technology market actively in both ways, i.e., license out and in. In addition, it is found that very young firm group founded after 1991 has higher rate of patent transactions with international counterparts.
More variation of IP strategy variables can be found across industry or technology classification of firm. Technology classification is determined by major patent class based on all patent applied in current year.[4] In both industry and technology classification, �edrugs�f shows a peculiar pattern (high rate of LO-USE and LI), which is consistent with a founding that patent protection is relatively strong in this industry (NISTEP, 1997; Cohen et. al., 2002). At the same time, USE is very low in �eDrug�f, because pharmaceutical firms typically hold a large list of patented chemical entities as potential seeds for new products. In addition, �eR&D services�f and �eother services�f[5] show an interesting pattern. These industries are technology providers, but not users (high LO-no Use and low LI). In electrical, electronics and precision machinery industry, we can see relatively higher CROSS and lower LO-FEE and LI-FEE. Higher value of CROSS can be found in �eDevice�f and �eCommunication Technology�f as well, which is consisted with findings in Nagaoka and Kwon (2002), using licensing data from financial reports of Japanese listed companies. Semiconductor is a typical product with cumulative technology, and it is difficult to fabricate it by only in-house technology. Cross licensing is often used as a working solution in this industry to reduce transaction costs associated with licensing agreements for a large number of patents. (Grindley and Teece, 1997)
SIPA covers survey items of the value of licensing transactions as well. One of major problem with patent counts is a difficulty in controlling for its value. Licensing statistics can cover up this shortcoming. Moreover, in SIPA data, transaction within firm group and with outsiders can be distinguished. Licensing within firm group cannot be treated as transactions in external technology market. Patent use indicators in Table 1 may be biased by such internal transactions. Information from this survey items can serve as a complement to IP indicators by patent counts in this context as well. Table 2 shows summary statistics of the value of licensing transaction by type of counterparts. In this table, 2002 and 2003 data are pooled together as is the case for Table 1.
(Table 2)
A first look at this table gives us an impression that the value of licensing is relatively small as compared to the value of sales. In most of cells, the number showing the ratio of licensing to sale is less than 1%. However, there are exceptions, �edrug�f and �eR&D and related services�f. In these industries, this ratio indicates more than 10% for licensing out. Since the absolute size of licensing in is very small for �eR&D and services�f and the portion of within group transaction is large, these firms are working as a technology provider to their parent firms. In contrast, the size of licensing contract is large in �edrug�f industry. In addition, it is found that more than 80 % of licensing out comes from international counterparts, although it is not shown in the table. Japanese pharmaceutical firms use licensing out its patents to gain access to international markets.
4. Econometric Analysis of IP Strategy and its Relationship with R&D
In this section, firm level IP strategy is further investigated. It is found that IP strategy at firm is heavily depending on its product market (industry classification) and its technology field (technology classification). Cross industry (technology) differences in licensing activities have been studied in previous literature. Anand and Khanna (2002) compared characteristics of licensing contract across industries, and explained them in terms of the strength of patents rights. For example, licensing of chemicals including drugs is likely to be made by an exclusive contract, because technology market works relatively efficiently there due to the strength of IPRs for such technology.
Alongside with cross industry (technology) difference, there must be substantial inter firm variation of IP strategy within the same industry. Arora (1997) illustrates changes in technology market structure of chemical industry before and after World War II. It used to be an industry where secrecy is an important means for appropriability of innovation, but transactions in technology market have become popular due to technological changes based on advancement of synthesis chemical. In this process, entry of oil refinery companies with open technology strategy stimulated the shift of industry behavior toward more market transaction of technology. In addition, Grindley and Teece (1997) compared IP strategy of four electronics companies, IBM, ATT, TI and HP.
This paper focuses on this firm level heterogeneity of IP strategy, and its relationship with R&D strategy is investigated. In this section, 10 types of IP strategy indicators in the previous section are used again. In order to focus on within industry and technology variation, I take out the mean of each indicator by industry and technology category[6] from its value. After this demeaning process, only variances within each industry and technology category are left.
First, descriptive regressions for these demeaned indicators are conducted. Results are shown in Table 3. Each of 10 indicators in previous section plus two new indicators from licensing statistics (LI/S and LO/S, the ratio of the value of licensing in and out, to the sales, respectively) is regressed by the following explanatory variables.
�E AGE: log of firm�fs age (years old)
�E
�E SALEAGE: cross term of �eage�f and �esale�f
�E IPEMP: ratio of employees at IP section to the total employees
�E PAT-HI: focus of technology area in patent application by Herfindahl index from patent applications in current year by 12 types of technology category
�E PATSIZE: log of the number of patent owned
�E EMP: log of number of employees
�E EMPAGE: cross term of EMP and AGE
Regressions are conducted to use unbalanced panel data from 2002 and 2003 surveys, and all models are estimated by random effect model with firm specific time invariant error components.
(Table 3)
After taking out
cross industry and technology effects, a major variance left is one associated
with firm size.
These indicators are related each other as well. It is natural because the same variable is used to come up with multiple indicators, but more importantly, a mix of these indicators constitutes a certain type of IP strategy of firms. In order to grasp the type of IP strategy from multiple indicators, I conduct principal component analysis. Table 4 shows pair-wise correlation matrix of 10 IP strategy indicators. Although each indicator is correlated in a complex way, it is clear that the pairs of LO_FEE and LI_FEE, and LO_INTER and LI_INTER are positively correlated each other. Therefore, I drop LI_FEE and LI_INTER from a list of variables, and calculate principal components of 8 variables. Coefficients with first three components are shown in Table 5.[8] For these three components, more than 50% of total variance can be explained.
(Table 4) and (Table 5)
I interpret each of three principal components as following IP strategic options.
�E PC1: Open strategy for outward and inward licensing, where positive coefficients are loaded on LO_USE, LO_noUSE (outward) and LI (inward).
�E PC2: Technology provider strategy, where a negative coefficient is found in LI, while a large positive coefficient is on LO_noUSE, the share of licensed out patents but not used by its own
�E PC3: Selectively licensing strategy, where small but positive coefficients are loaded on LO_USE and LO_noUSE. In addition, large coefficient is found with LO_FEE, the share of patents licensed out with royalties.
I have conducted
the same descriptive regression as is in the Table 3 for each of three
principal components as a dependent variable, and found that IPEMP is
positively correlated with PC1, but not with the others. [9] That
is, PC1 strategy reflects active use of technology market for innovation. In
addition,
These IP strategy variables are regressed with R&D variables to investigate the relationship between IP strategy and in-house R&D. Here, I use two types of R&D variables, i.e., the size of R&D (RD: log of current R&D investment) and the diversity of R&D scope. The latter variable needs some explanation. SIAP conducts survey on the number of patent application by 12 technology category in four years from now. This information is used for patent application forecasting by JPO, but this would be a good indicator for the scope of R&D project currently conducted. Herfindahl index is calculated based on this information, and is named RD-HI.
Regression results are displayed in Table 6. In this analysis, unbalanced panel data sets from 2002 and 2003 survey is used, and all models are estimated by random effect model with firm specific time invariant error components. Two types of R&D variables are regressed by three types of IP strategy variables, as well as controlling variables, i.e., log of sale, its squire, log of patent pool size as well as 35 industry and 12 technology class dummies.
(Table 6)
Negative and significant coefficients with PC2 in Model (1) disappears when PATSIZE is included as explanatory variables in Model (2). Since IP strategy variables may be endogenous to RD, these variables are instrumented by IPEMP (the ratio of IP section employees to total), AGE (log of firm age) and dummy variable for licensing in Model (3). However, the result does not change. In Model (4), cross terms of IP strategy variables with PATSIZE are included, because we know the coefficients with PCs change very much from Model (1) to Model (2). Here we have some statistically significant coefficients with IP strategy variables. As for PC1, taking partial derivatives of PC1 leads to 0.137-0.022*PATSIZE. This means for smaller PATSIZE, PC1 (Open IP Strategy) leads to larger R&D, and vice versa for larger PATSIZE. As for PC2, only cross term with PATSIZE has statistically significant and negative coefficients, which implies that PC2 (Technology Provider Strategy) leads to relatively smaller R&D investment.
Does active use of
technology market spur R&D? The answer is yes for a firm with smaller size
of patent pool, no for a firm with large one. The threshold point of the size
of patent pool is about 500 according to model (6), but the number of firms
with more than 500 patents is 341 out of 6072 firms in 2003 data. It should be
noted that this result, based on a panel dataset with short interval, captures cross
sectional views as compared to inter temporal characteristics. Therefore,
positive relationship between open IP strategy and in-house R&D for a smaller
patent pool firm may capture a snap shot of development process of its
technology pool using both in-house development and external technology source.
On the other hand, technology provider strategy does not result in higher
R&D investment as compared to other strategy.
The same kind of regression analysis is conducted for RD-HI as well. Here, there is only one statistically significant coefficients in Model (5), however this is lost when PATSIZE is included in Model (6) again. Instrument variable estimate or plugging in cross terms does not help. It is generally concluded that there no clear effect of IP strategy on the scope of R&D. However, it should be noted that a mild positive sign of PC1 to RD-HI, meaning that �gOpen IP Strategy�h puts more focus on R&D project in terms of technology area. One speculation based on this finding is that Open IP Strategy leads to focusing on its core technology, with active technology sourcing from external bodies.
5. Conclusion
In this paper, IP strategy at firm level is analyzed in a framework of firm�fs innovation activities. A dataset from JPO�fs SIPA provides detail information on firm�fs patent pool, and firm�fs strategy of its development and use. There exist substantial cross industry and technology variations of various IP strategy indicators, and the results in this paper are generally consistent with past literature showing cross industry difference on licensing contracts such as Anand and Khanna (2002).
In this paper, firm level heterogeneity after controlling for industry and technology field, is also investigated. According to descriptive regression of IP strategy variables, it is found that the younger and the smaller a firm is, the more it uses external technology market for its innovation activities. However, the regression results also indicate some disadvantages of smaller firms, such as positive relationship between licensing and size of IP section. In addition, a firm needs to have certain size of patent pool in order to make cross licensing contract, which may be another disadvantageous factor for smaller firms.
Finally, information on IP strategy indicators is aggregated by principal component analysis, and the first three components are picked up as IP strategy options, i.e., �eopen licensing strategy�f, �etechnology provider strategy�f and �eselectively licensing strategy�f. These IP strategy variables are regressed with R&D size and technological breath of R&D, in order to understand the relationship between IP strategy and R&D. For a firm with smaller patent pool, it is found that active use of technology market pushes up R&D investment, but no clear relationship can be found with the scope of R&D.
A straight implication from these findings is that technology licensing is not simple buying or selling of technology, but is related with in-house R&D. A firm with open licensing technology with relatively small patent pool spends R&D more than other firms. In addition, for these firms, active both ways of licensing can be found. It may be the case that such firm uses its own IPs for improving its bargaining position in licensing in negotiation with other firms. Cross licensing is one of institutions to facilitate such strategic use of own IPs for external technology sourcing. In an era of fierce innovation competition, Japanese firms are departing from in-house innovation model, and seeking for more external collaboration with other firms, universities and research organizations. In this process, strategic use of technology market becomes important, and a firm must understand the value of own IPs, not only for innovation process of its own, but also for leveraging its positioning in competition in technology market as well as product market.
It is more difficult to come with IPR policy implications. While stronger patent right will induce technology more market transactions, a firm�fs response depends on its IP strategy, and a government needs to conduct welfare analysis with understanding heterogeneous nature of firm�fs strategy and its distribution. Based on the results in this paper, stronger patent right is likely to induce innovations in young and small firms, because they rely on external technology source more than large established firms. In addition, open licensing strategy firms with small patent pool invest in R&D more than other type firms. In this sense, pro-patent IPR policy may be compatible with transition of Japanese national innovation system, dominated by large firms, toward dynamic one with active involvements of start up firms and SMEs.
References:
Anand,
B. and T. Khanna (2002), The Structure of Licensing Contracts, Journal of
Industrial Economics, March 2000, vol. 48, pp. 103-135
Arora, A. (1997), Patents, Licensing, and Market
Structure in the Chemical Industry, Research Policy 26, pp.391-403
Arora A. and A. Fosfuri (2003), Licensing the
market for technology, Journal of
Economic Behavior & Organization, vol. 52, pp. 277-295
Arora A. and A. Fosfuri (2000), The Market for
Technology in the Chemical Industry: Causes and Consequences, Revue D�feconomie Industrielle, no. 92,
2e and 3a trimesters 2000, pp. 317-334
Arora, A., Fosfuri, A and A. Gambardella (2001),
Markets for Technology, The Economics of
Innovation and Corporate Strategy, MIT Press
Cohen,W., A. Goto, A. Nagata, R. Nelson and J.
Walsh (2002), R&D spillovers, patents and the incentives to innovate in
Japan and the United States, Research
Policy, vol. 31, pp. 1349-1367
Grindley P. and D. Teece (1997), Managing
Intellectual Capital: Licensing and Cross-Licensing in Semiconductors and
Electronics,
Hall, B. and R. Ziedonis (2001), An Empirical
Study of Patenting in the US Semiconductor Industry, 1979-1995, Rand Journal of Economics, Vol. 32, No.
1 pp. 101-128
Lanjouw,
J. O. and M. Schankerman (2003), Enforcement of Patent Rights in the
Lanjouw, J. O. and M.
Schankerman (2001) �gCharacteristics of Patent Litigation: A Window on
Competition,�h The Rand Journal of
Economics. Vol. 32, no. 1, pp. 129-51.Lerner, J. (1995), Patenting in the
Shadow of Competitors, Journal of Law and Economics, vol. 38, pp. 463-496
Mazzoleni,
R. and R. Nelson (1998), The benefits and costs of strong patent protection: a
contribution to the current debate, Research
Policy, vol. 27, pp. 273-284
Mergis, R. and R. Nelson (1990), On the complex economics of patent scope, Columbia Law Review, vol. 90, pp. 839-916
Motohashi, K. (2003),
Nagaoka,
S. and H. U. Kwon, Unilateral vs Cross Licensing: How do firm characteristics
affect licensing decisions?, Hitotsubashi University Institute of Innovation
Research, IIR-WP-2003-2
NISTEP
(National Institute of Science and Technology Policy) (1997), Appropriability
and Technological Opportunity in Innovation: A Japan-U.S. Comparative study
using survey data, (in Japanese) NISTEP REPORT No. 48
RIETI (Research Institute of Economy, Trade
and Industry) (2004), Report on RIETI�fs Survey on External Collaboration in
R&D for Japanese Firms (in Japanese), Research Institute of Economy Trade
and Industry, March 2004
Figure 1. Framework of Analyzing IP Strategy of Firm

Figure 2: IP Strategy Indicators